Charts for Flutter Mobile and Web
Many applications need to display data in the form of charts. Recently, I tried creating charts in Flutter for mobile and web and wanted to guide you through its implementation.
In this example, we will use the charts_flutter package.
To get started, we need to add it as a dependency in pubspec.yaml:
dependencies:
  charts_flutter: ^0.9.0
This package includes a gallery of examples with code snippets showing how to implement each type of chart. In this post, we’ll walk through creating a chart.
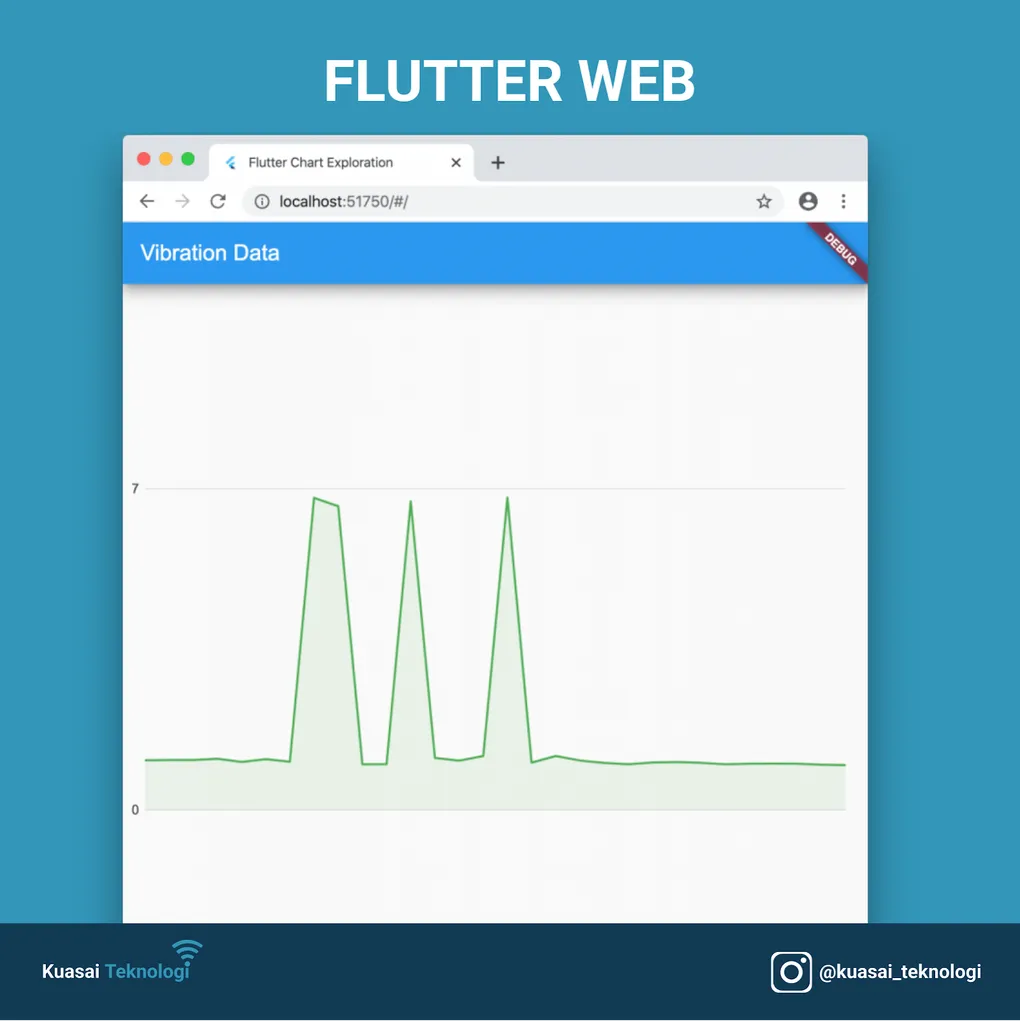
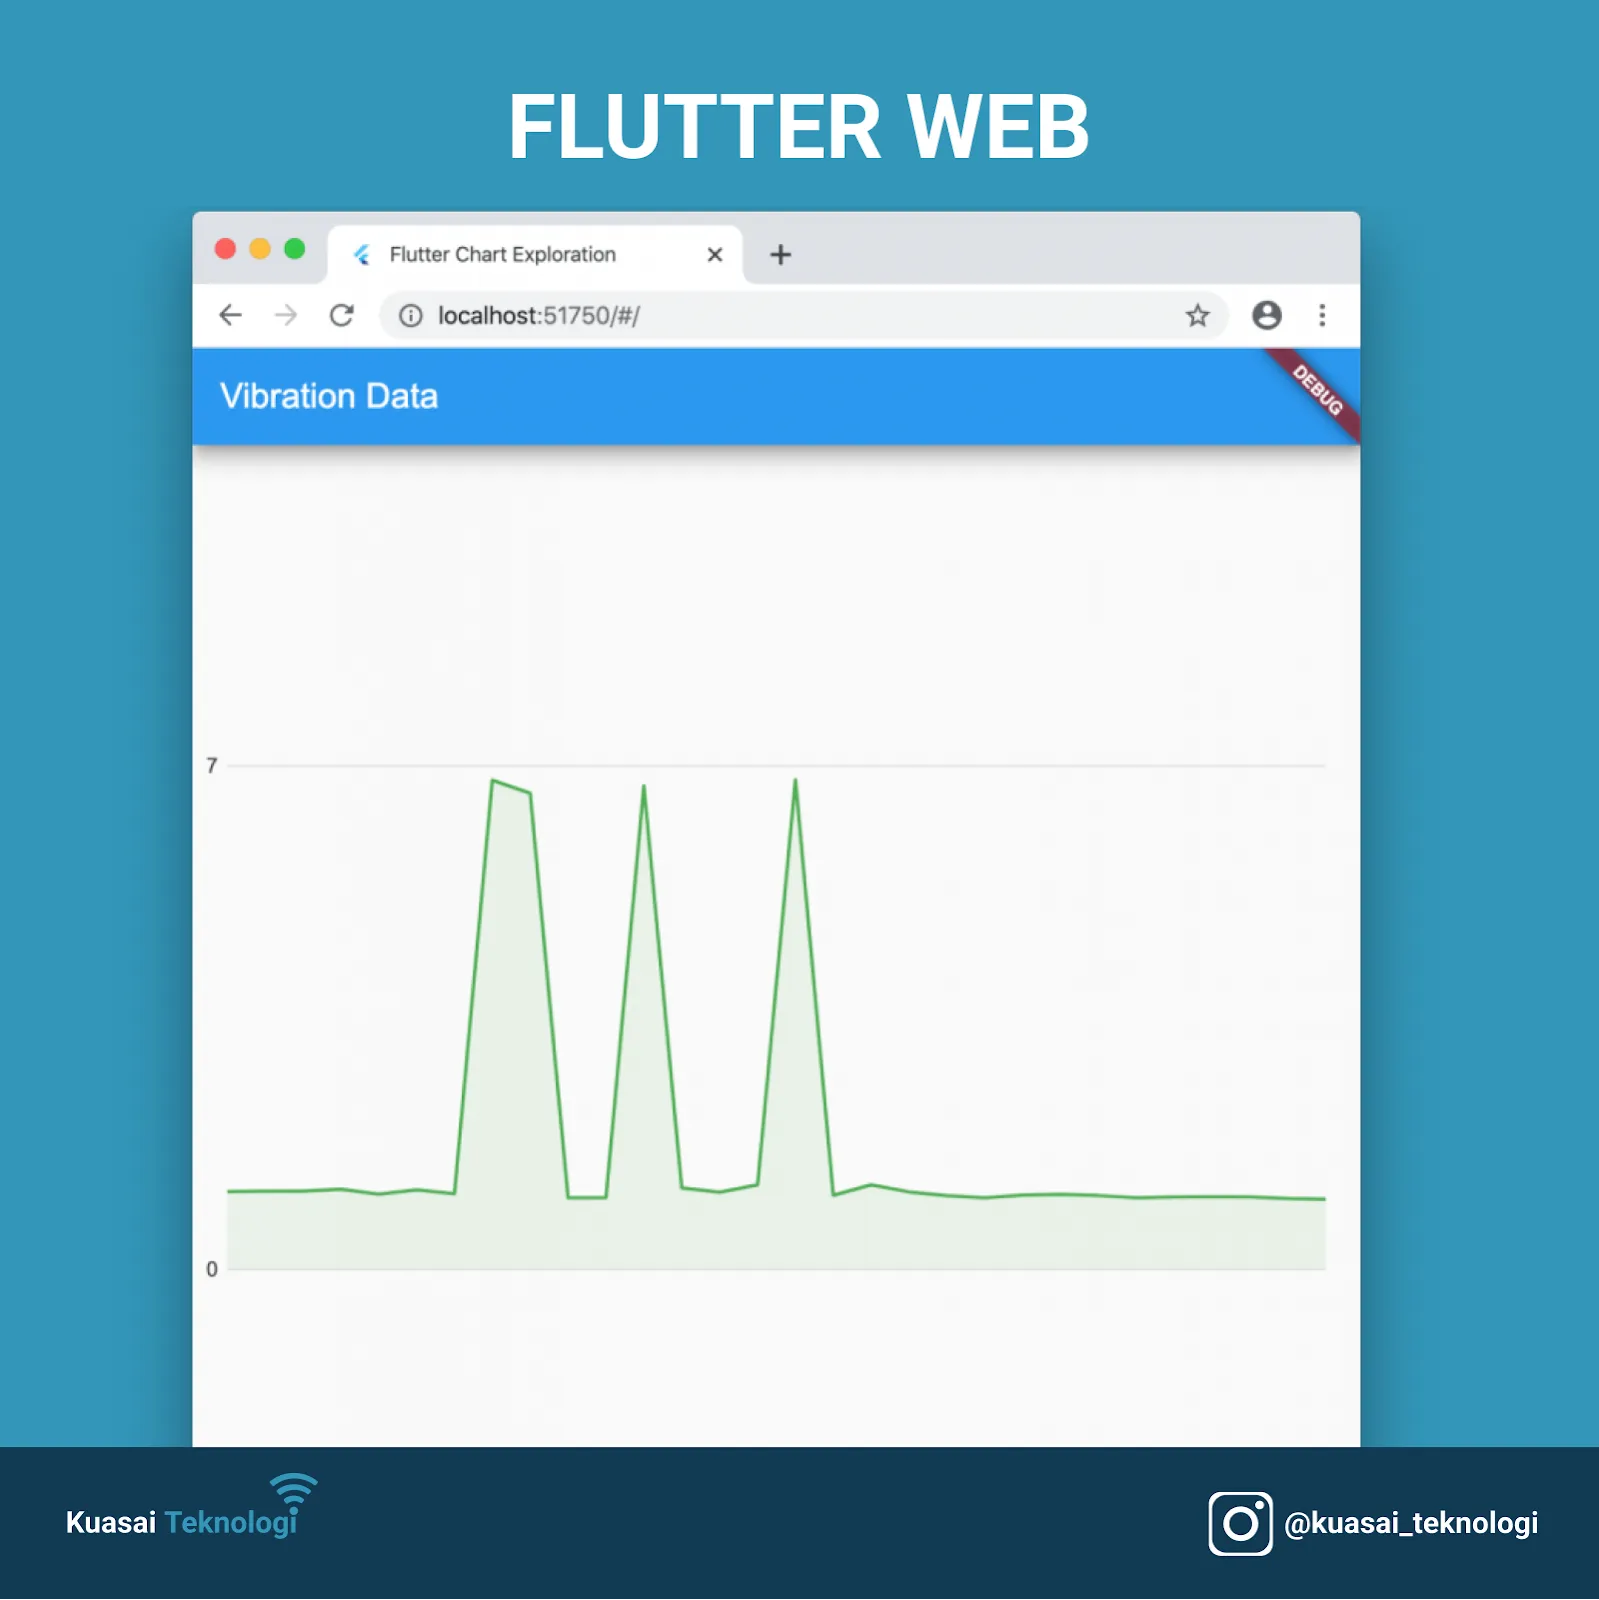
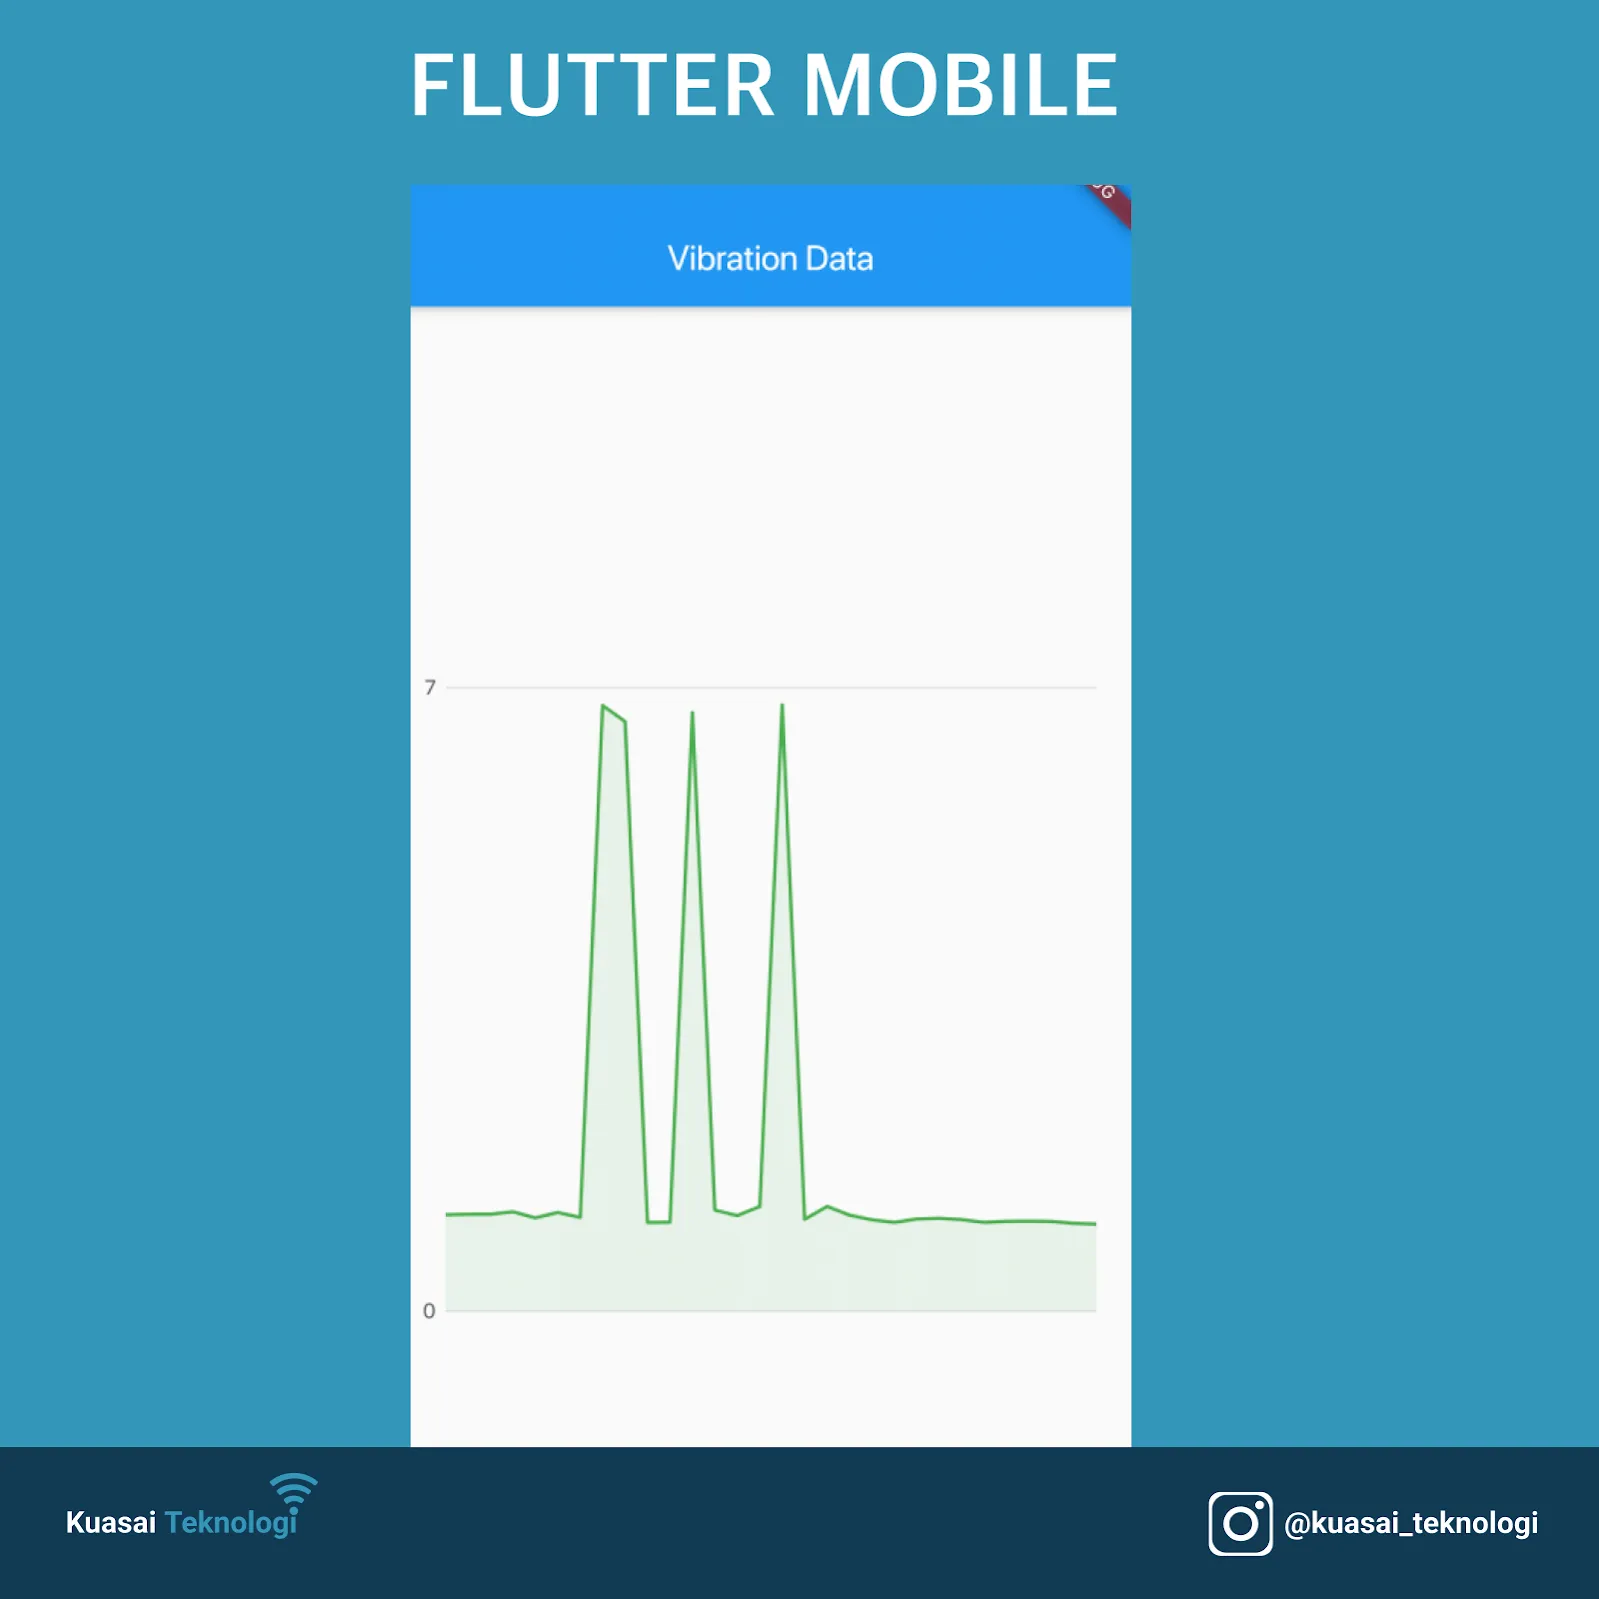
The final result will be an application that displays a chart in both Flutter Mobile and Web.
After importing the package, we need to retrieve data from our source and transform it into a model that the chart library can use. We’ll start with a repository pattern, creating a ReportRepository class. Our data comes from sensor devices providing vibration data and trip counts.
Each report entry looks like this:
{
    "date": "2020-01-15T19:00:00-0500",
    "trips": 553,
    "vibration": 1.08154506437768,
    "doors": 1161
}
We will parse this data from a local JSON file and return it as a list of reports.
class Report {
  final String date;
  final double vibration;

  Report({this.date, this.vibration});

  factory Report.fromJson(Map<String, dynamic> json) {
    return Report(
        date: json['date'] as String,
        vibration: json['vibration'] as double);
  }
}
For this example, we are only interested in vibration data.
Next, we’ll convert the “API” data into a model object that charts_flutter can consume. The library expects a series of data associated with a domain. They provide a factory to populate these objects:
factory Series({
  @required String id,
  @required List<T> data,
  @required TypedAccessorFn<T, D> domainFn,
  @required TypedAccessorFn<T, num> measureFn,
  // ... other properties
})
We need to map our report entries (date and vibration measurement) into this series factory.
We’ll start by converting our report data again into something more specific for the chart.
Note: You could do this when retrieving data from the API, but sometimes it’s better to keep your domain models pure and map them to view-specific models as needed. This helps maintain separation and minimizes impact if other areas of the application start depending on the report model.
This is the model we will map our entries to:
class VibrationData {
  final DateTime time;
  final double vibrationReading;

  VibrationData(this.time, this.vibrationReading);
}
Next, we leverage the Series factory. We’ve created a static function that takes a list of VibrationData and returns a Series type for charts_flutter.
static List<Series<VibrationData, DateTime>> _createChartData(List<VibrationData> vibrationData) {
  var data = [
    new Series<VibrationData, DateTime>(
      id: 'Desktop',
      colorFn: (_, __) => MaterialPalette.green.shadeDefault,
      domainFn: (VibrationData vibrationData, _) => vibrationData.time,
      measureFn: (VibrationData vibrationData, _) => vibrationData.vibrationReading,
      data: vibrationData,
    ),
  ];

  return data;
}
Now we are ready to use the Series data with our chart! We just need our Series data for the TimeSeriesChart:
TimeSeriesChart(List<Series<dynamic, DateTime>> seriesList, {etc})Pass in the Series data we created, and the chart will be displayed:
TimeSeriesChart(vibrationData)In our sample implementation, we set some optional fields and wrap the chart in a FractionallySizedBox:
FractionallySizedBox(
  child: TimeSeriesChart(
    vibrationData,
    defaultRenderer: new LineRendererConfig(
        includeArea: true, stacked: true),
    animate: false,
    domainAxis: new DateTimeAxisSpec(renderSpec: NoneRenderSpec()),
  ),
)
And that’s it! This will successfully display on both mobile and web.
Full Code available here.